Income rises with the cohort.
The generated cohort is not just more rows with a demographic label. Income rebalances sharply: the Rs. 25,001-50,000 band moves from 19% of input to 61% of generated rows, while no-income responses fall from 48% to 9%.
The Synthetic Data Studio gives consumer insights, market research, and advanced analytics teams a controlled workspace for cohort boosting, causal scenario modeling, and outcome targeting. Bring a completed tracker, U&A, concept test, pricing study, sensory study, or customer dataset. Simulacra learns the population response structure, then lets your team ask what changes when price, claims, segments, behaviors, or attitudes move — in real time, from the data you already have.
Built for insights and research teams: guided workspace, packaged onboarding, validation support, included generated-row volume, stakeholder-ready outputs, and a repeatable workflow from upload to analysis.
CSV, Excel, SPSS export. As few as 300–500 rows. The Studio normalizes types, surfaces the cleaned schema, and flags low-signal columns before training.
Simulacra fits the response structure of your respondent population. Usually in 60 seconds or less. Single-tenant container, processed in an isolated session, never combined with another customer's data.
Boost thin segments, model interventions like a price change or marketing spend, and run scenarios on the data you already have. No new fieldwork required.
Graph distributions, pivot the generated population, and bring the result stakeholders need into the next meeting.
Generate statistically credible respondents for low-incidence cohorts, sparse segments, and priority cuts — without pretending those groups are simpler than they are.
Set a measured variable (price, pack size, claim, occasion, awareness, preference, satisfaction) and see how the rest of the study moves with it.
Start with the business result you want, then search for the respondent conditions and scenario paths your data supports.
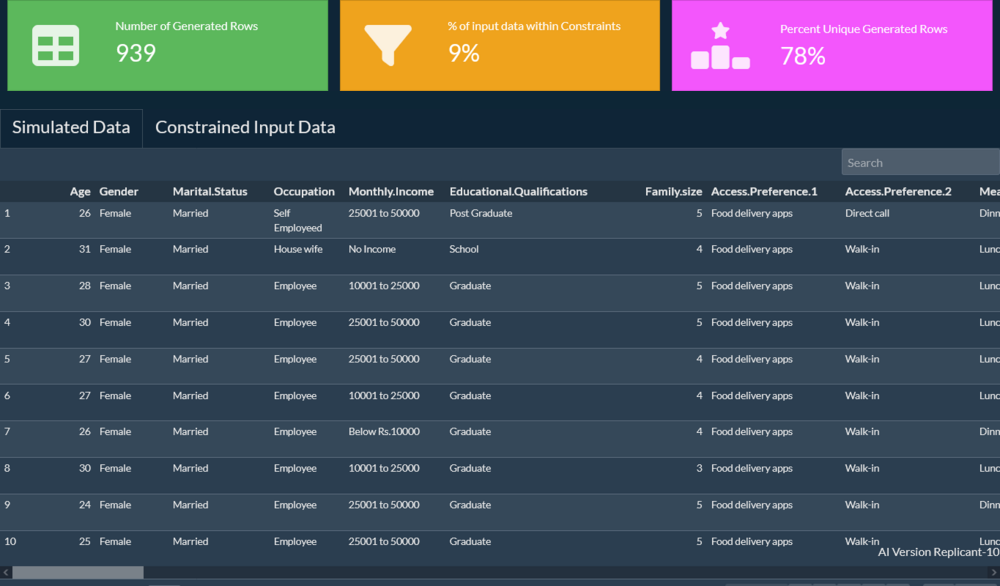
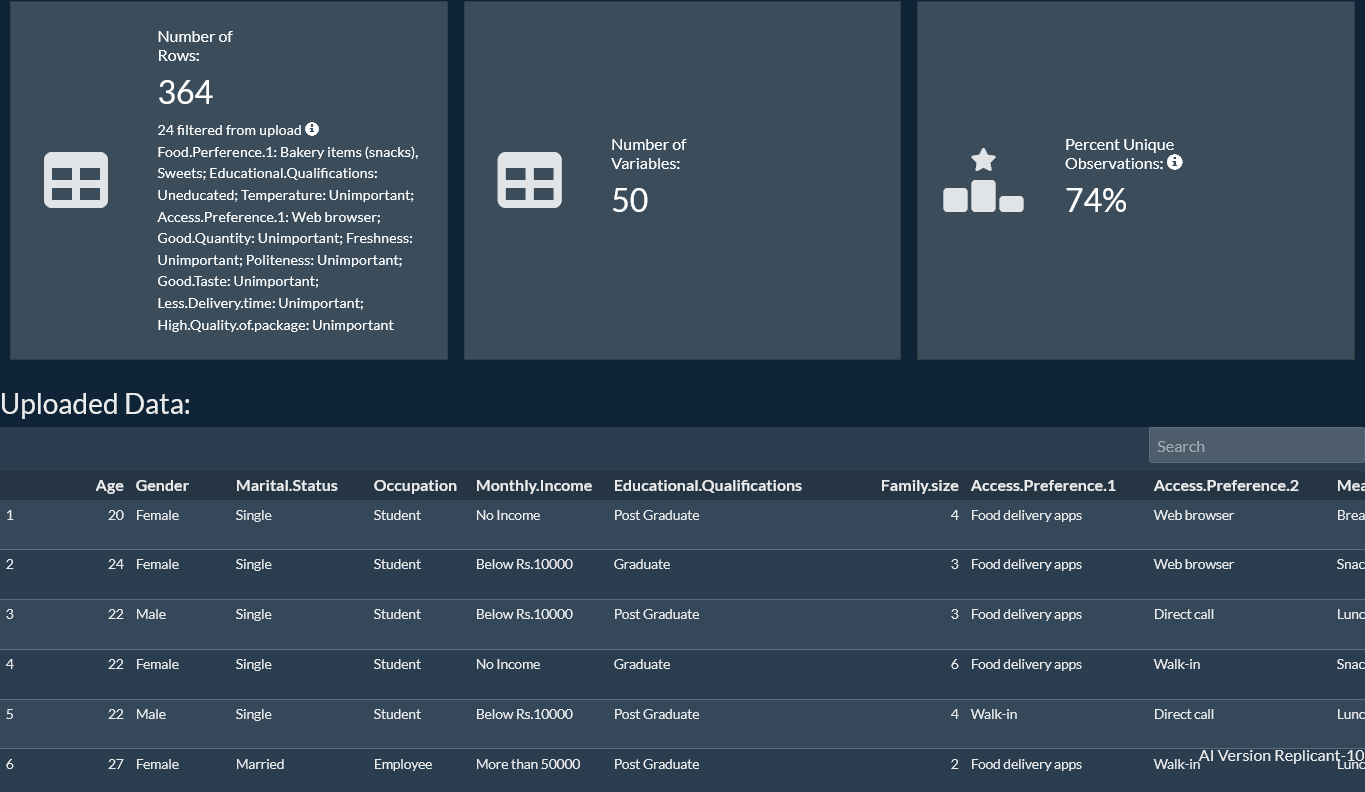
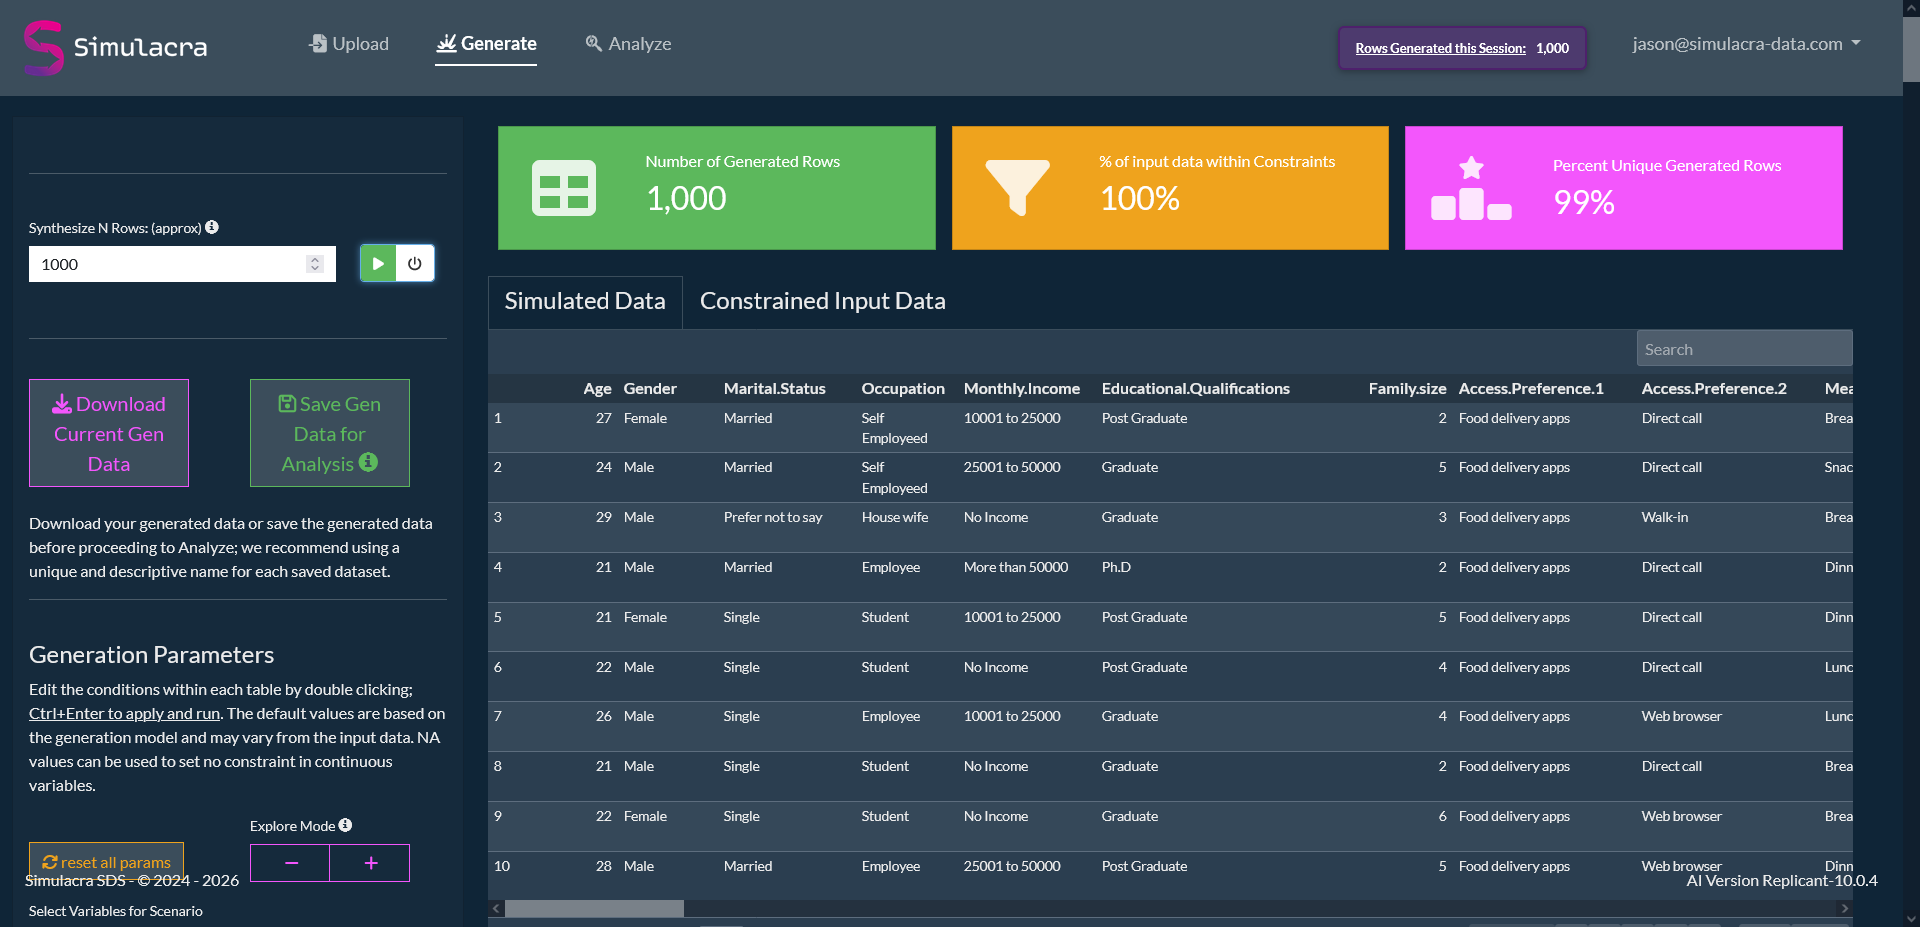
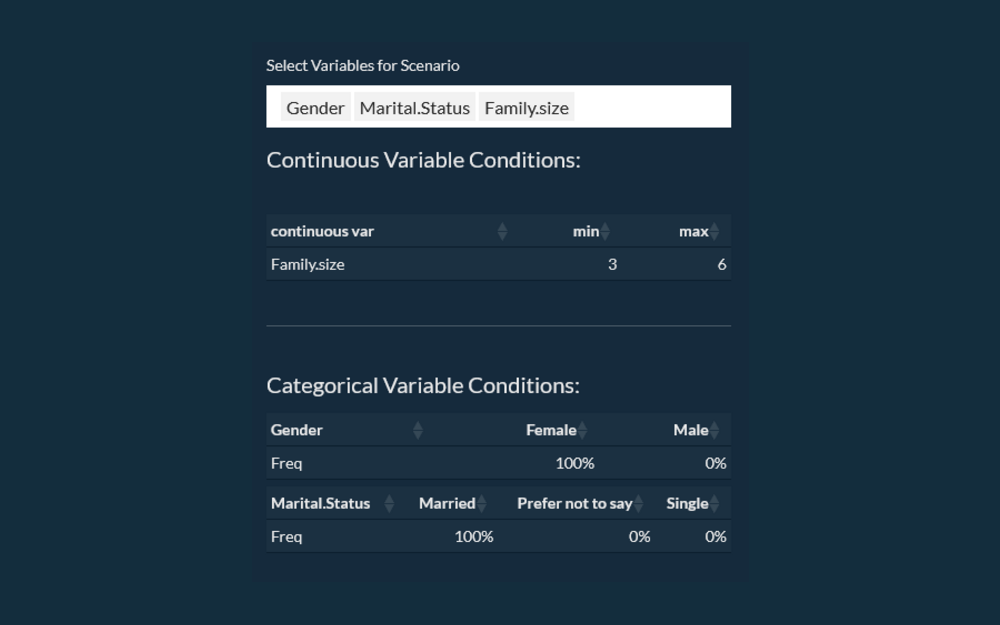
In this demo, the Studio boosts a narrow cohort from a completed online-delivery study: married women in 3-6 person households. That cohort represented only 9% of the observed input. Simulacra generated 939 constrained rows, then let the downstream economics, behavior, demographics, and satisfaction responses move together.
cleaned rows
of input matched constraints
generated rows
unique in the constrained output
The generated cohort is not just more rows with a demographic label. Income rebalances sharply: the Rs. 25,001-50,000 band moves from 19% of input to 61% of generated rows, while no-income responses fall from 48% to 9%.
Lunch becomes the dominant occasion in the generated cohort, moving from 32% of input to 63% of generated rows.
The cohort shifts strongly toward vegetarian food occasions, from 17% of input to 85% of generated rows.
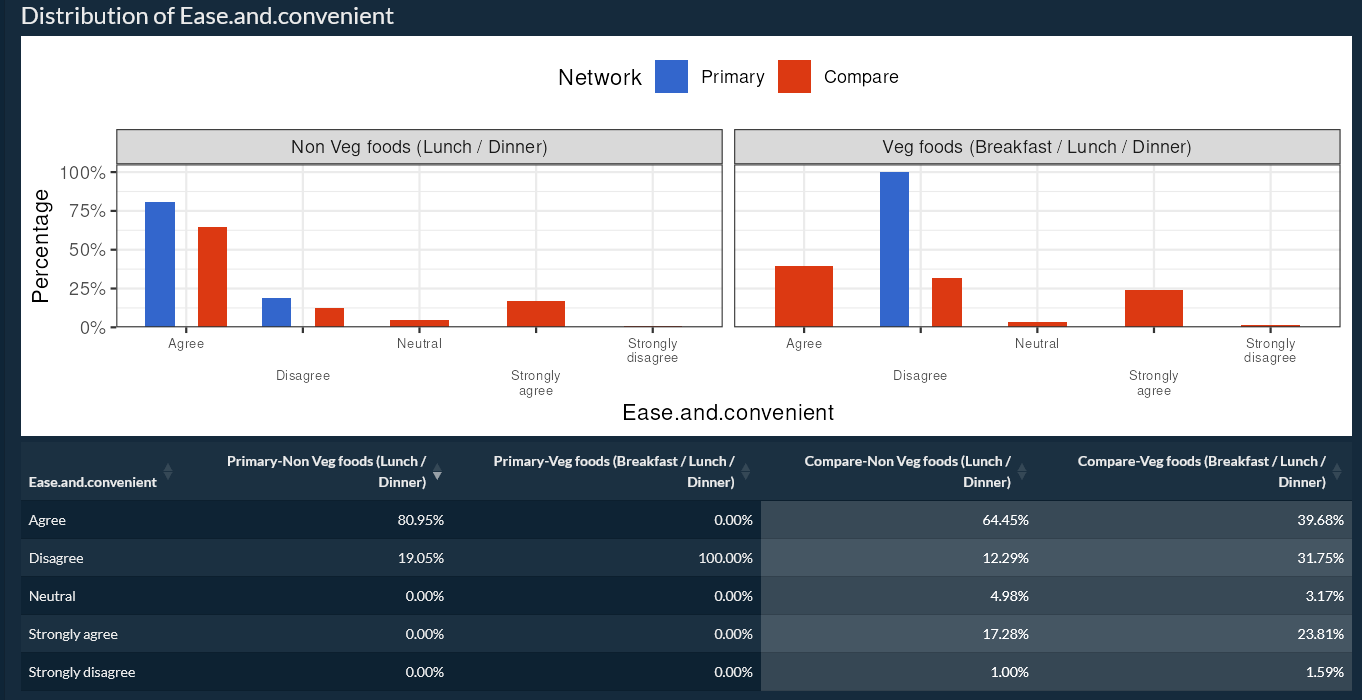
The Studio also surfaces trade-offs: agreement that delivery is easy and convenient drops while disagreement rises in the constrained cohort.
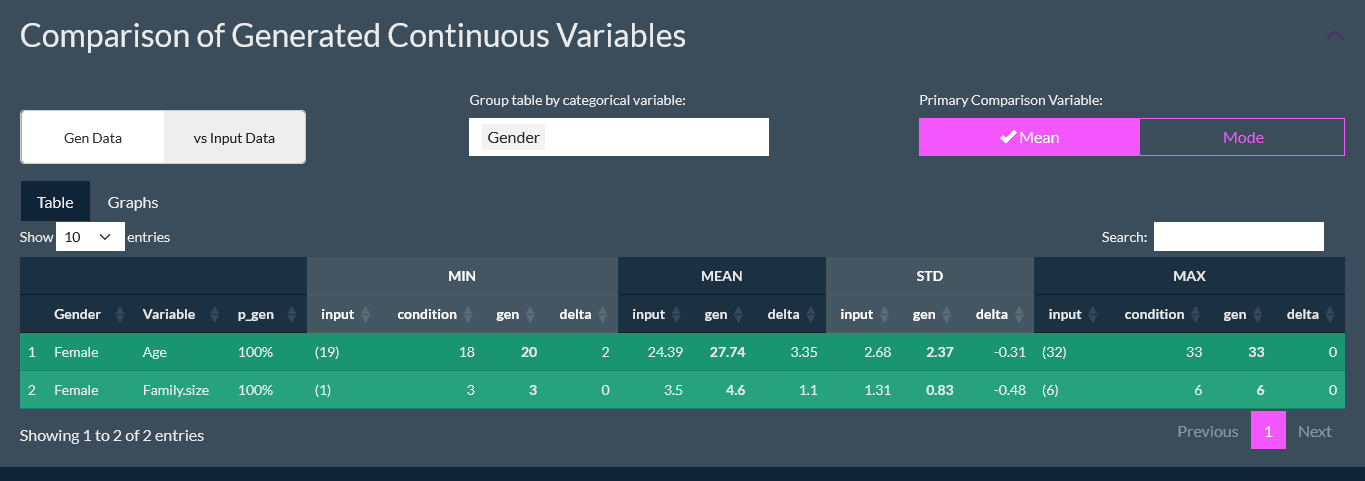
Within the female cohort, mean age moves from 24.39 to 27.74 and mean family size moves from 3.5 to 4.6.
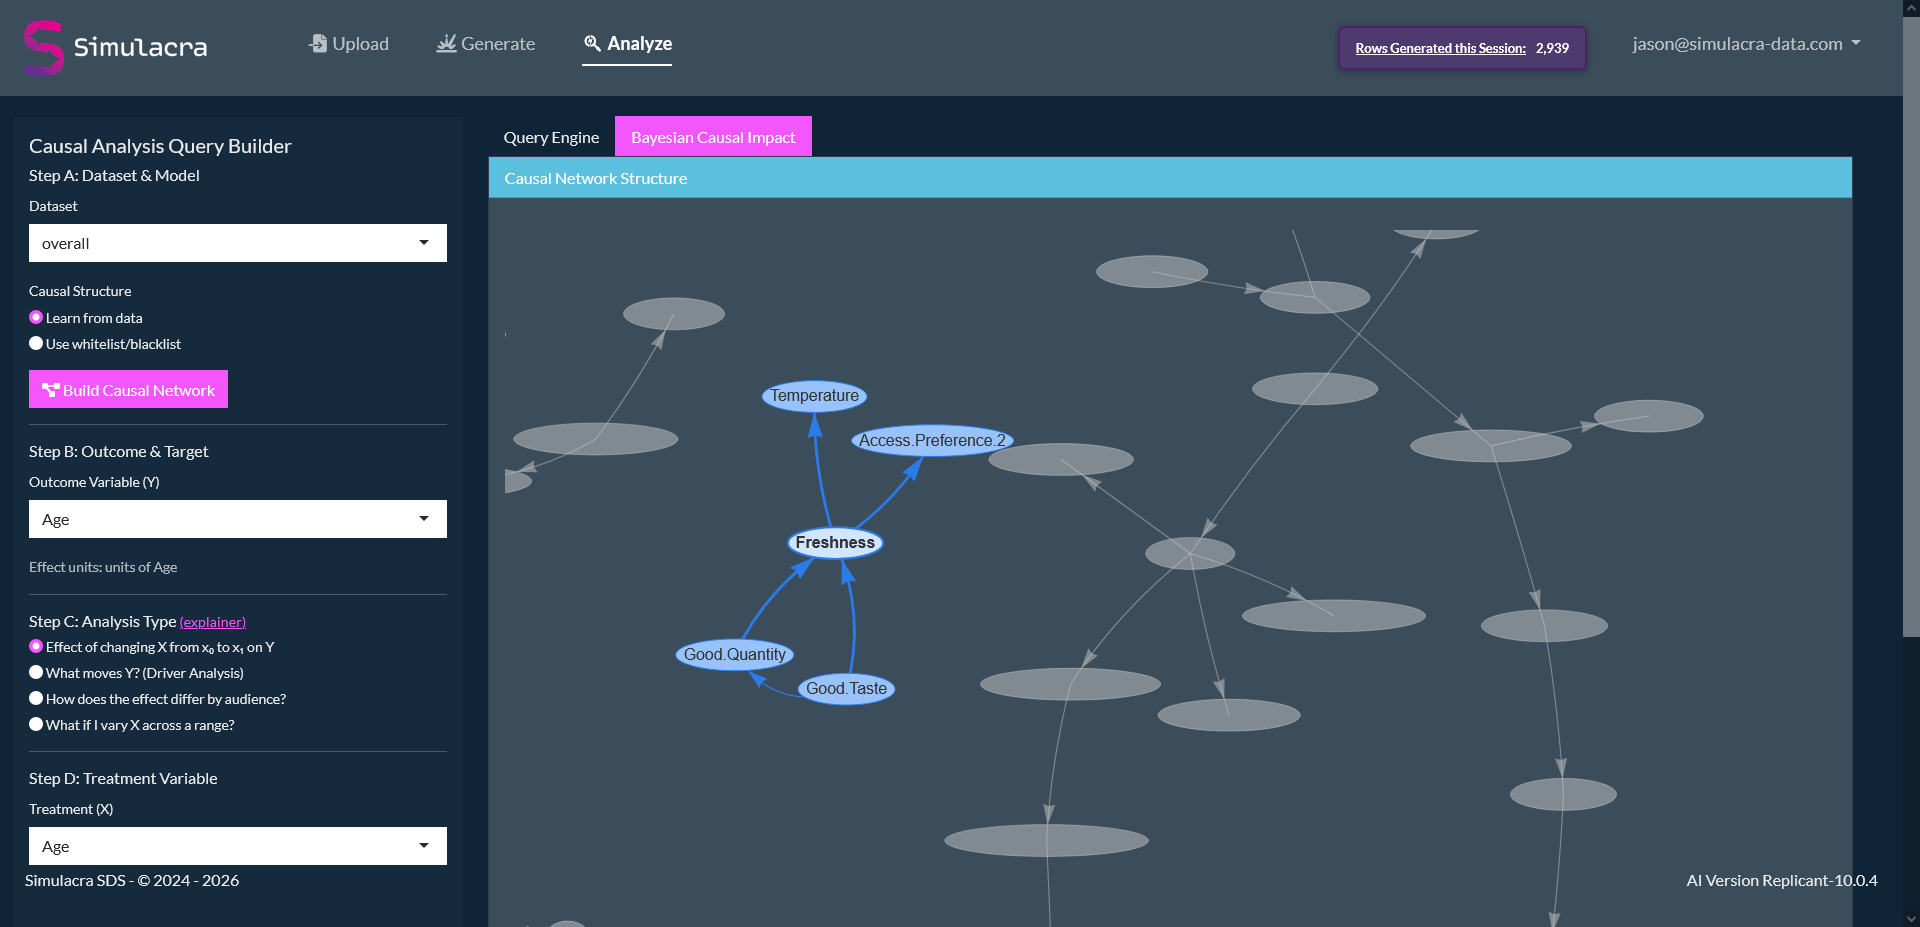
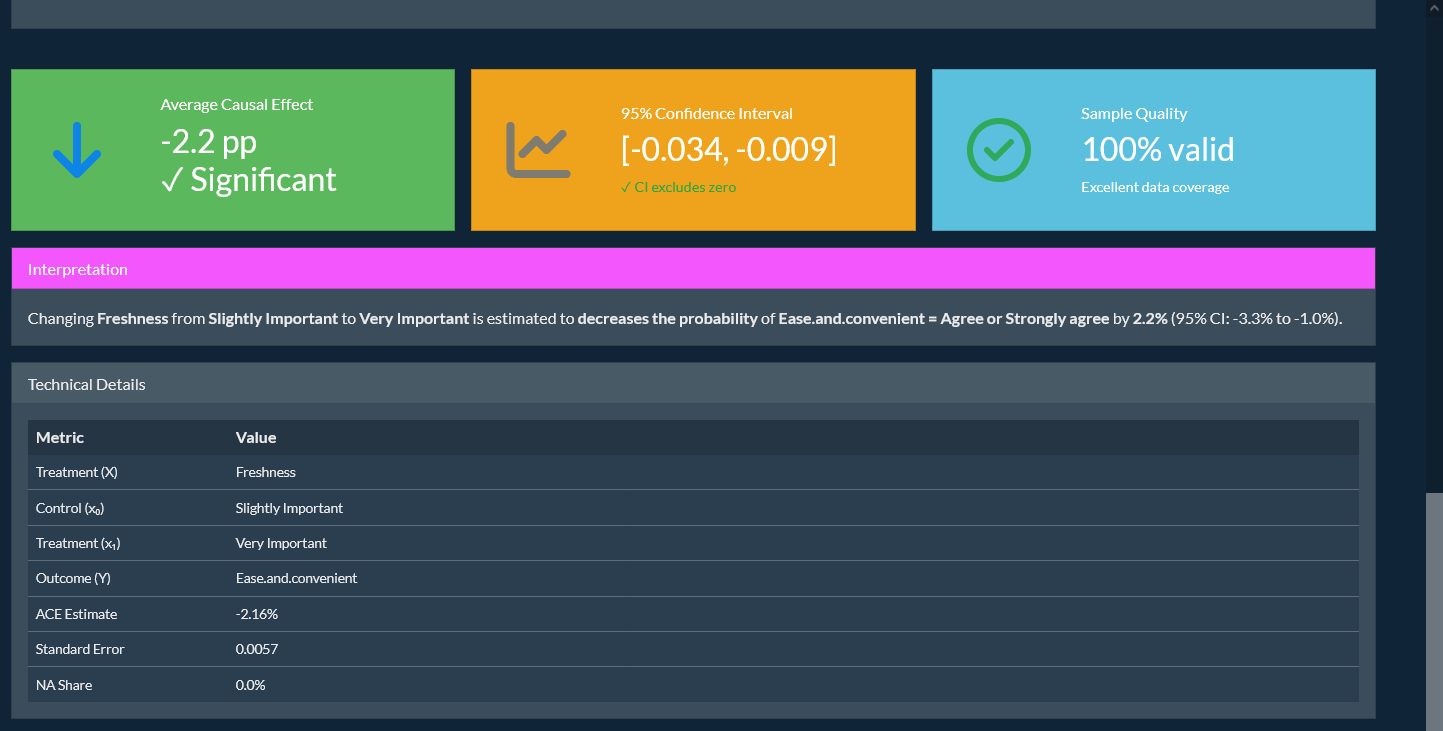
The Analyze tab keeps causal estimation inside the governed project. Select an outcome, treatment, graph assumption, and analysis type; the Studio returns effect size, uncertainty, significance, and sample-quality diagnostics tied to measured variables rather than free-form interpretation.
Stabilize priority cuts, simulate movement in awareness and preference, and pressure-test what changes downstream.
See the use case →
Run do(price), promo, volume, and margin scenarios from data your team already trusts.
See the use case →
Understand which features, messages, or claims move trial, preference, and segment composition.
See the use case →
Model low-incidence cohorts without collapsing them into averages.
See the use case →
Expand an under-sampled population or cohort in your existing research. Synthesized rows behave the way your respondent population behaves.
Reduce volatility in tracker cuts wave-over-wave. Borrows strength from prior waves while preserving wave-level signal.
Run do(X) interventions and audience rebalancing, then inspect how downstream variables shift together. Predict the way your respondent population would actually respond.
View the cleaned schema the engine actually trained on, after our automated cleaning: column names, levels, low-signal drops.
Synthetic-row labels on every export, scenario assumptions captured in the methodology appendix, project-level access controls.
CSV, Parquet, SPSS, R, Python, Tableau, Power BI. Methodology appendix attached on every export.
Predict causal effects on generated populations and outcome scenarios, plus segment-level heterogeneous effects and automated reporting. Read more.
Holdout backtests, distribution overlap checks, novelty audit, infeasibility reports. Run on any customer dataset, anytime, by the Simulacra team.
Each project runs in an isolated single-tenant container. Customer data is trained zero-shot, processed in memory, and never combined with another customer's data.

Simulacra does not train across customers. Customer datasets are used to fit the requested model or validation workflow for that customer, inside the agreed environment and retention terms. The Studio is designed for enterprise review: privacy, security, validation, and methodology are part of the workflow, not afterthoughts.
We'll walk through the platform on a real dataset — yours or ours — running a cohort boost, a causal intervention, and a scenario-modeling pass. ~45 minutes. Standard NDA if you bring your own study.