Average Causal Effect (ACE)

Sometimes the world changes around you, sometimes you change the world.

Predict causal effects on generated populations and outcome scenarios. Simulacra's Generative Causal AI models the world your data actually measured. Simulacra ACE estimates the effect of interventions in that generated world.

Predict the effect of your interventions.

Simulacra ACE turns data into testable decisions. Price, claim, feature, spend, pack size, offer: choose the intervention, compare it against baseline, and predict the outcome. The module packages Pearl's do-calculus into a no-code workflow for causal intervention modeling, so teams can review the structure behind the estimate and return the effect, interval, diagnostics, and appendix in one pass.

Effect estimates

Effects by population and segment

ACE estimates the population-level shift under an intervention. CATE estimates the average effect by cohort, profile, region, or segmentation.

ACE

Average causal effect

One contrast for the fitted population, with the estimate, confidence interval, and support read attached.

ACEX→Y(x0, x1) = 𝔼[Ydo(X = x1)] − 𝔼[Ydo(X = x0)]
Example contrast do(price = high) vs. baseline Δpurchase intent
Population +4.8pp n = 2,400; 95% CI [+2.0, +7.6]; support 0.96
CATE

Conditional average treatment effect

The same contrast cut by segment, with the estimate, confidence interval, and support read attached to each cut.

CATEX→Y(x0, x1Z = z) = 𝔼[Ydo(X = x1), Z = z] − 𝔼[Ydo(X = x0), Z = z]
Same contrast do(price = high) vs. baseline Δpurchase intent

By segment

Core buyers +7.2pp n = 980; 95% CI [+4.0, +10.4]; support 0.93
New buyers +2.1pp n = 640; 95% CI [−0.2, +4.4]; support 0.88
Price sensitive not significant n = 520; 95% CI [−4.2, +1.0]; support 0.81
High intent +5.6pp thin support n = 92; 95% CI [+0.8, +10.4]; support 0.31
ACE in the Studio

Causal discovery and effect estimation in the same Studio.

Define the treatment, baseline, outcome, and segments. Simulacra learns or accepts the causal structure, runs ACE and CATE on the generated population, and returns the estimate, interval, support diagnostics, and appendix.

Build the causal structure

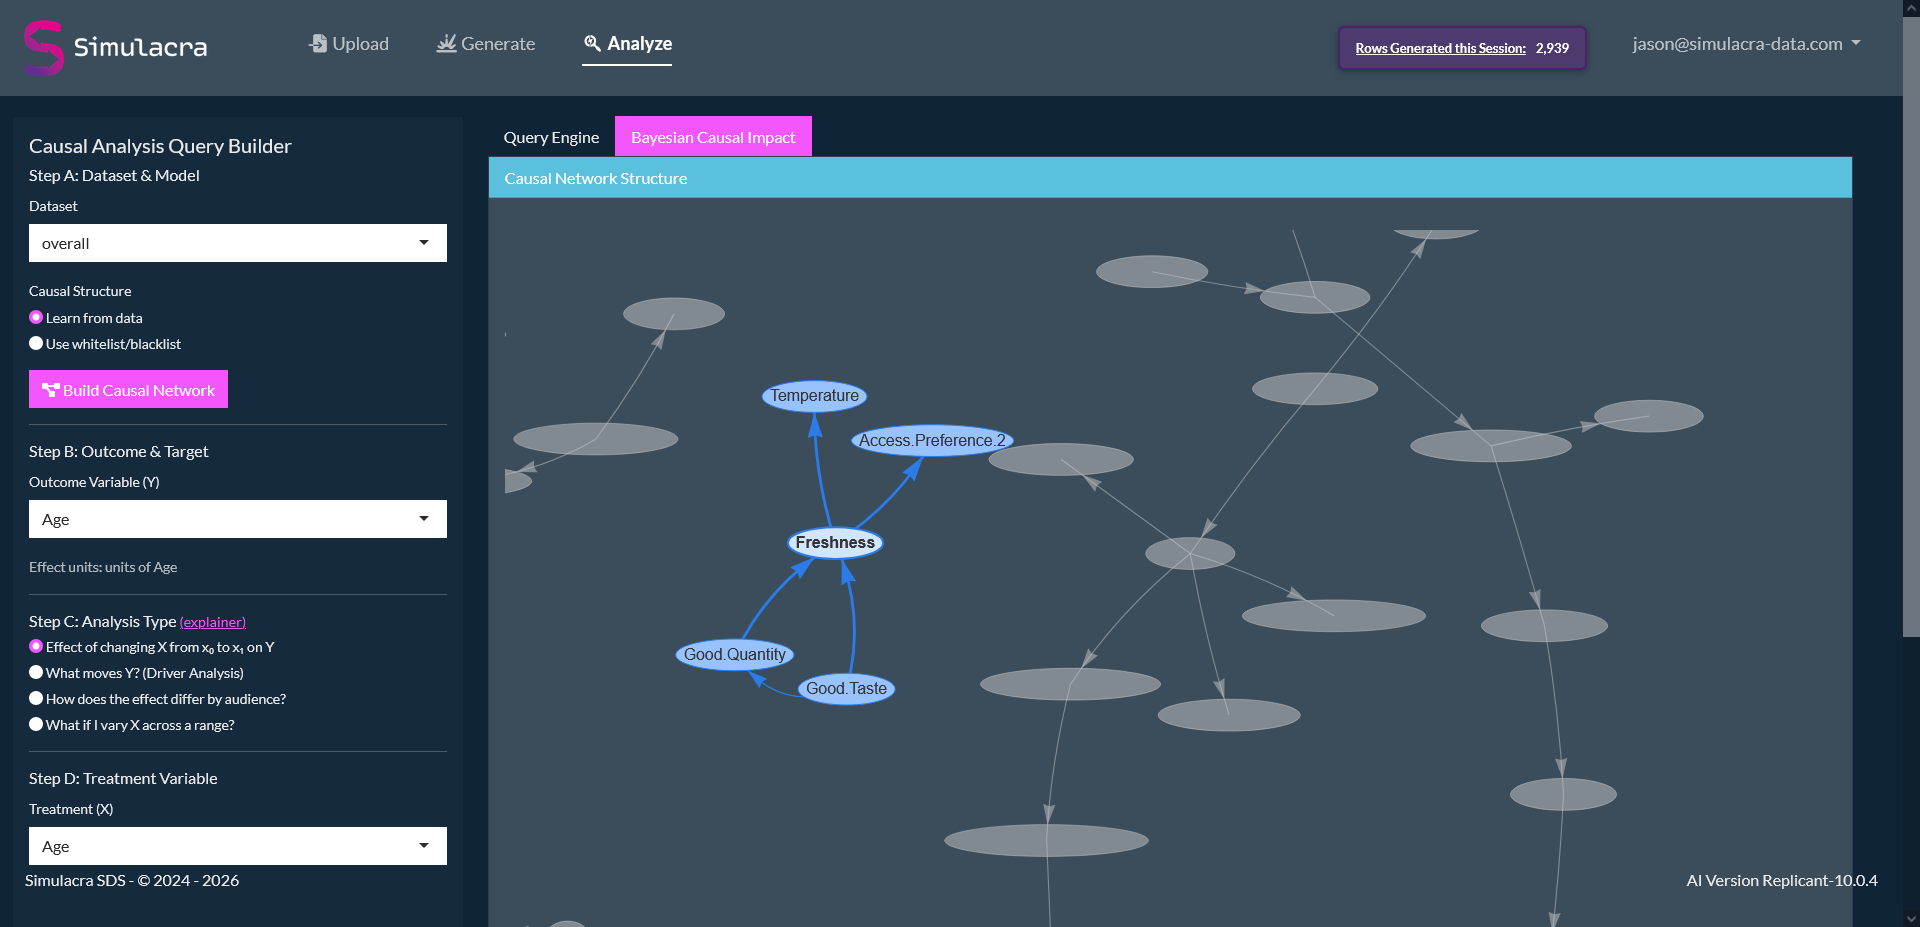
ACE depends on the structure behind the variables: the causal relationships among the variables, what needs adjustment, and which paths are impossible. Simulacra builds a DAG structure from the fitted data, domain constraints, or both, so the estimate starts from an interactive causal graph.

Learn the graph

Start from a causal network learned from the fitted data instead of drawing every edge by hand.

Apply domain constraints

Whitelist relationships that must hold and blacklist paths the team knows cannot be true.

Keep mixed fields together

Use numeric, categorical, ordered, count, and continuous fields in the same graph, including numeric-to-category and category-to-numeric parentage.

ACE module causal network structure view with highlighted causal paths among measured variables.
Causal network view from the Studio: learned structure, visible constraints, and reviewer-facing model context.

Results from research, decisions with evidence.

Once the treatment, baseline, and outcome are named, the hard part is the causal query: identify confounders, check support, choose the right segment cuts, and keep uncertainty visible. Simulacra ACE automates those steps and returns the estimate, interval, support diagnostics, segment comparisons, and appendix in one report.

Define the contrast

Set the treatment, baseline, outcome, segment cuts, and analysis type in the Studio.

Estimate the effect

Return ACE, confidence interval, CATE cuts, and plots from the same fitted workflow.

Defend the result

Keep support diagnostics, assumptions, and methodology notes attached to the estimate.

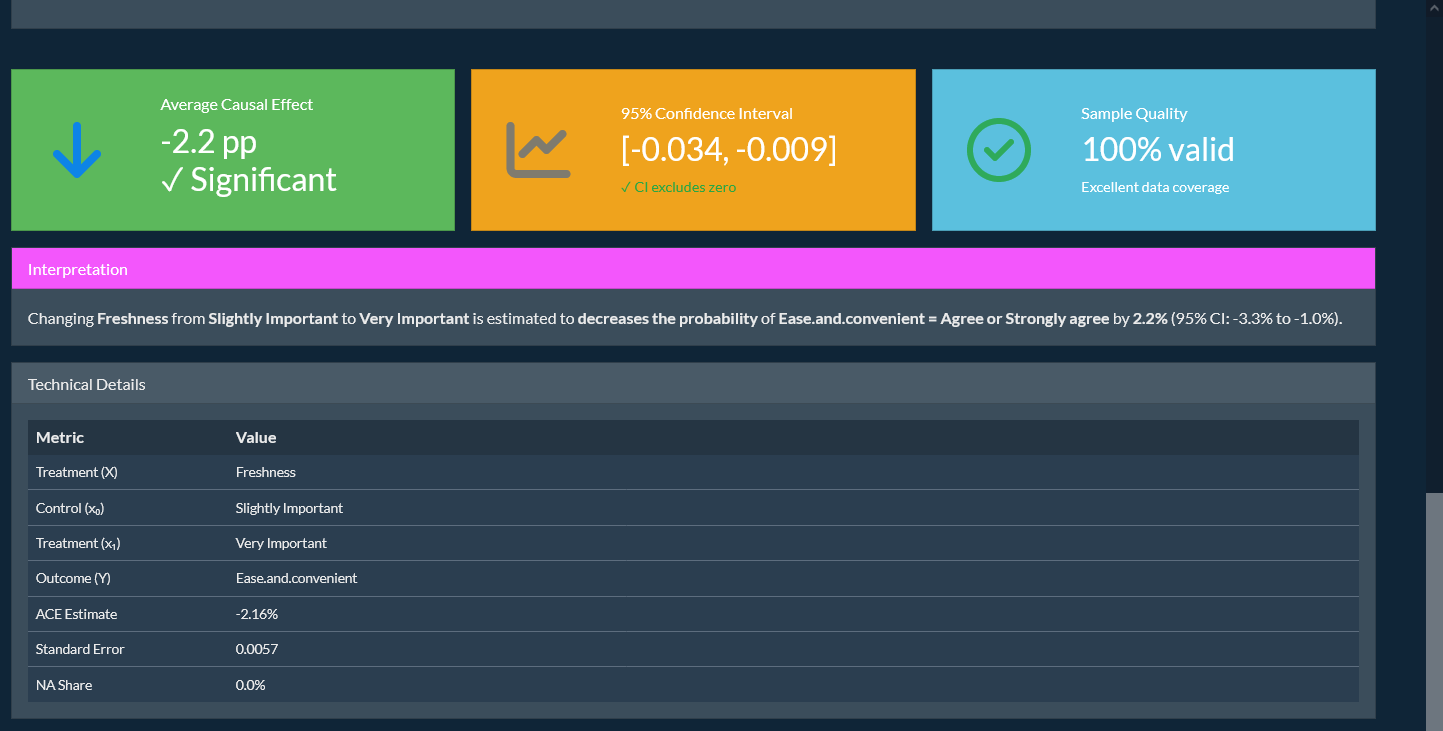
ACE module results showing average causal effect, confidence interval, sample quality, interpretation, and technical details.
ACE output from the Studio: effect estimate, confidence interval, sample quality, interpretation, and technical details in the same report view.

Causal inference, made operational.

Traditional causal-inference tools require the analyst to specify the graph, the adjustment set, the variance-reduction method, and the diagnostics by hand. Simulacra runs them as defaults of the workflow.

Automated causal setup

Define treatments, outcomes, and segments visually in the Studio. Simulacra selects contrasts, identifies adjustment sets, and shows the choices behind the estimate.

Mixed-type variable support

Continuous outcomes and treatments, binary and multi-category variables, ordered factors, zero-inflated counts, censored observations — all handled in one model, including category-to-numeric and numeric-to-category relationships.

Positivity-aware inference

Detects infeasible treatment combinations, bounds estimates where coverage is thin, and suggests which missing cells would most improve the analysis. Refusal is part of the contract.

Run ACE on your data

Let us intervene... we have a good effect.

Bring a study you already fielded. We'll define the intervention, estimate the effect, cut it by segment, and show the diagnostics behind the answer. Standard NDA, no contract required.